Towards Zero Carbon — GHG standards and role of Data Management and Machine Learning

“Emissions of the anthropogenic greenhouse gases (GHG) that drive climate change and its impacts around the world are growing. According to climate scientists, global carbon dioxide emissions must be cut by as much as 85 percent below 2000 levels by 2050 to limit global mean temperature increase to 2 degrees Celsius above pre-industrial levels.1 Temperature rise above this level will produce increasingly unpredictable and dangerous impacts for people and ecosystems. As a result, the need to accelerate efforts to reduce anthropogenic GHG emissions is increasingly urgent.” Quote from the Greenhouse Gas Protocol Product Life Cycle Accounting and Reporting Standard specification
Zero carbon is increasingly on the agenda on an organization’s ESG strategy and is being linked to Company’s overall corporate and business goals. However, the path or journey to achieve zero carbon is complex and needs direction, leadership and discipline across the organization and beyond including suppliers, partners and customers in the ecosystem to navigate the journey
GHG Value Framework
Many companies are just starting their carbon accounting journeys. For those that are already doing it, there is an opportunity to streamline and scale. An effective corporate climate change strategy requires a detailed understanding of a company’s GHG impact. It allows companies to take into account their emissions-related risks and opportunities and focus company efforts on their greatest GHG impacts. Companies may find most value in using a phased approach, starting with establishing a carbon accounting foundation aligned with accounting protocols and reporting standards for compliance and disclosure.

Using a goal driven approach, guided by business goal framework helps plan and prioritize and implement as per the company’s objectives and governance mechanisms that include Project and Product Management office and Change Management

A value framework helps identify strategic objectives tied to each business goal. While there is an organic order to the business goals framework with Reporting, Compliance as the foundation, different organizations may combine the goals in different ways as per their needs. For example, there may be stronger need to achieve product life cycle efficiencies and reduction targets for some organizations while for others Supplier, Value Chain may take higher precedence
Data Management — Role of Data
Data collection can be the most resource intensive step when performing a product GHG inventory. Data can also have a significant impact on the overall inventory quality with downstream impacts on reporting, tracking. Establishing a data management strategy and process helps documents the product inventory process and the internal quality assurance and quality control (QA/QC) procedures in place to enable the preparation of the inventory from its inception through to final reporting. It is a valuable tool to manage data and track progress of a product inventory over time, and can also be useful as an assurance readiness measure since it contains much of the data needed to perform assurance. At a minimum the data management plans should contain the following items:
- Description of the studied product, unit of analysis, and reference flow
- Information on the entity(ies) or person(s) responsible for measurement and data collection procedures
- All information that describes the product’s inventory boundary
- Criteria used to determine when a product inventory is re-evaluated
- Data collection procedures
- Data sources, including activity data, emission factors and other data, and the results of any data quality assessment performed
- Calculation methodologies, including unit conversions and data aggregation
- Length of time the data should be archived
- Data transmission, storage, and backup procedures
- All QA/QC procedures for data collection, input and
handling activities, data documentation, and emissions calculations
As part of the data collection requirements, companies have to collect data for all processes included in the inventory boundary. That includes collecting primary data for all processes under their ownership or control. During the data collection process, companies have to assess the data quality of activity data, emission factors, and/ or direct emissions data by using the data quality indicators. The GHG standard defines five data quality indicators to use in assessing data quality:
- Technological representativeness: the degree to which the data reflect the actual technology(ies) used in the process
- Geographical representativeness: the degree to which the data reflects actual geographic location of the processes within the inventory boundary (e.g., country or site)
- Temporal representativeness: the degree to which the data reflect the actual time (e.g., year) or age of the process
- Completeness: the degree to which the data are statistically representative of the process sites
- Reliability: the degree to which the sources, data collection methods, and verification procedures used to obtain the data are dependable
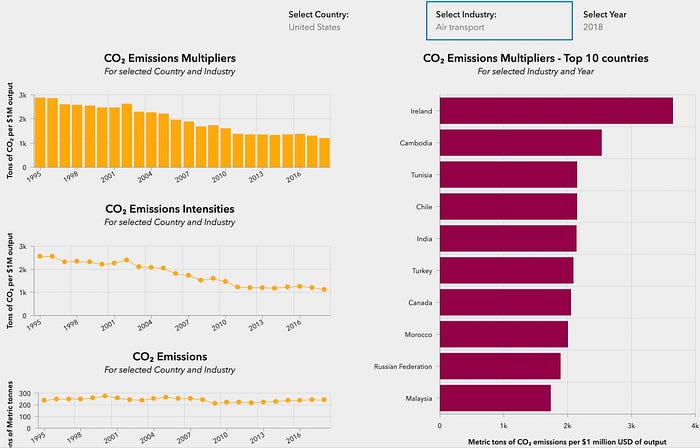
Sample CO2 dashboard below shows the result of above data management activities:
Assessing Data Quality
During data collection, there may be cases where several data types (direct emissions data, activity data, emission factors) and data classifications (primary and secondary) are available for the same process. Assessing data quality during data collection helps companies determine which data most closely represents the actual emissions released by the process during the studied product’s life cycle. Data quality indicators can be used to qualitatively or quantitatively address how well the data characterizes the specific process(es) in the product’s life cycle. The qualitative data quality assessment approach applies scoring criteria to each of the data quality indicators.

Reporting on Data Quality
Companies are required to report on the data sources, data quality, and efforts to improve data quality for significant processes

Data Gaps, Additional Considerations
Data gaps exist when there is no primary or secondary data that is sufficiently representative of the given process in the product’s life cycle.
Proxy data
Proxy data are data from similar processes that are used as a stand-in for a specific process. Proxy data can be extrapolated, scaled up, or customized to represent the given process. Companies may customize proxy data to more closely resemble the conditions of the studied process in the product’s life cycle if enough information exists to do so. Data can be customized to better match geographical, technological, or other metrics of the process. Examples of proxy data include:
Estimated data
When a company cannot collect proxy data to fill a
data gap, companies should estimate the data to determine significance.

In addition to above gaps, below quality considerations apply:
Allocated data
Data that has been collected to avoid allocation are preferable to data that require allocation. For example, with other data quality indicators being roughly equal, data gathered at the process level that does not need
to be allocated is preferable to facility-level data that needs to be allocated between the studied product and other facility outputs. Allocation requirements include:
• Allocating emissions and removals to accurately reflect the contributions of the studied product and co-product(s) to the total emissions and removals of the common process
• Avoiding allocation wherever possible by using process subdivision, redefining the functional unit, or using system expansion
•If allocation is unavoidable, allocate emissions and removals based on the underlying physical relationships between the studied product and co-product(s)
• When physical relationships alone cannot be established or used as the basis for allocation, companies shall select either economic allocation or another allocation method that reflects other relationships between the studied product and co-product(s)
• Companies shall apply the same allocation methods to similar inputs and outputs within the product’s life cycle
Uncertainty
Data with high uncertainty can negatively impact the overall quality of the inventory. Uncertainty requirements include reporting a qualitative statement on inventory uncertainty and methodological choices. Methodological choices include:
- Use and end-of-life profile
- Allocation methods, including allocation due to recycling
- Source of global warming potential (GWP) values used
- Calculation models
Role of Machine Learning in Data Management

Shown above is an example of a machine learning pipeline for CO2 estimation and forecasting. The results from this workflow help drive accuracy comparison, target setting and monitoring and trend and variance analysis
There are many aspects of Data Management which could be made feasible, improved, automated, and better handled through use of various machine learning techniques. Mentioning some of the higher priority items from the data management section above:
a) Criteria used to determine when a product inventory is re-evaluated — Supervised learning techniques could be used to determine the triggers to re-evaluate and predictive ML approach could be taken to automate the re-evaluation. This is especially applicable in highly variable domains with rapid change in product inputs, materials, supply chain, costs etc
b) Data collection procedures — There may be a need to score various procedures both qualitatively and quantitatively to determine the optimum mix that meets the data quality criteria. Supervised, Unsupervised, Ranking and Scoring techniques could help reduce the time, effort and cost and provide better quality outputs
c) Data sources, including activity data, emission factors and other data, and the results of any data quality assessment performed — To address the data gaps noted above, different flavors of ML and Data Engineering techniques could be applied including Classification, Clustering, Probabilistic, Bayesian, Ensemble, Deep Learning. The higher priority areas to address would be the data estimation, imputation, allocation, calculation and uncertainty
Taking a measured or step by step approach to apply Machine Learning to these use cases for example by curating and prioritizing based on factors such as criticality, data availability and technical expertise would lead to more feasible and practical results
In Closing
The need for measuring the carbon footprint of products and services that any organization produces is foundational or baseline to establishing strategic ESG objectives such as zero carbon or net zero. This article attempts to provide insight into the business objectives and goals to drive such an initiative. And then focuses on the data management aspects highlighting the key focus areas for data including quality. Having established the core tenets of data, the machine learning section provides insights into applicable use cases and techniques. I hope the readers get a view into the landscape around zero carbon realization and are able to plan and take informed steps towards this key ESG initiative