Problem Diagnosis and Constraints Analysis for Ads Supply Side Provider — Supply Optimization
In the highly competitive digital advertising ecosystem, maximizing Ad supply efficiency is critical for both revenue generation and ensuring a seamless user experience. A balanced approach is key to achieving the optimization outcomes, with Revenue, Marketing and Data Science team working in close concert. In this article, I will illustrate the cross-functional challenges and constraints that these teams need to balance, as well as the metrics they should consider for evaluation.
Context: AdX Global, an ad supply-side platform, is facing performance inefficiencies in its ad inventory management. Specifically, there are challenges in optimizing fill rates and Revenue Per Mille (RPM) across different geographies, devices, and ad formats. The company’s revenue team is concerned with increasing revenue per ad placement, while the marketing team focuses on improving user engagement and reducing irrelevant ad impressions. The data science team is tasked with developing models that enhance ad supply optimization but requires proper alignment with business goals to ensure success.
Symptoms:
- Low Fill Rates in Key Markets:
- Certain geolocations (e.g., CA — Desktop) have significantly lower fill rates due to poor inventory allocation and bid management, resulting in unfilled ad requests and missed revenue opportunities.
2. Zero or Low RPM in Some Segments:
- Some device and geo combinations (e.g., AUS — Desktop) exhibit low or zero RPM, indicating a failure to serve ads or fill requests with relevant ads, leading to a negative impact on overall revenue.
3. Misaligned Priorities between Revenue and Marketing Teams:
- The revenue team focuses heavily on improving fill rates and RPM without adequate consideration of user engagement metrics.
- The marketing team is focused on improving ad relevance, measured by Click-Through Rate (CTR) and Bounce Rate, and is concerned that optimizing purely for revenue could result in a poor user experience due to irrelevant ads.
4. Model Performance vs. Business Relevance:
- While the data science team has developed initial models to optimize bid floors and inventory allocation, the business stakeholders are unable to interpret the model’s performance in terms of business-relevant KPIs like RPM uplift and user engagement improvements.
Sample Data and Analysis
To better illustrate the challenges and problem-solving process, let’s look at some sample data that AdX Global worked with:
- Fill Rate and RPM Data
The revenue team provided the following monthly data:
Month Fill Rate RPM ($)
Jan 65% 2.50
Feb 63% 2.45
Mar 68% 2.60
Apr 64% 2.55
May 66% 2.58
Jun 70% 2.75
Challenge: The data showed fluctuations in both fill rate and RPM, with no clear upward trend.
2. Ad Placement Performance
The marketing team provided data on different ad placements:
Placement Click-Through Rate User Engagement Score Avg. Time on Page (sec)
Header 2.1% 7.5 45
Sidebar 1.8% 6.8 50
In-Content 2.5% 8.2 55
Footer 1.2% 5.5 40
Challenge: Balancing user experience with ad performance.
3. Bid Request Data
Sample of bid request processing data:
Hour Total Requests Processed Requests Avg. Processing Time (ms) Win Rate
1 1,000,000 800,000 120 15%
2 1,200,000 900,000 135 14%
3 1,500,000 1,050,000 150 13%
4 1,800,000 1,080,000 165 12%
Challenge: As the number of requests increased, the system struggled to process them all, leading to lower win rates.
4. Inventory Allocation
Current inventory allocation:
Ad Format Allocation % Fill Rate eCPM ($)
Display 50% 70% 1.80
Video 30% 60% 3.50
Native 20% 75% 2.20
Challenge: Suboptimal allocation of inventory across different ad formats.
Taking the sample data above, let’s apply constraints identified by Revenue and Marketing teams:
Revenue Constraint Example: Minimum Fill Rate
- Constraint: Fill Rate ≥ 70%
- Current Data:
Ad Format | Fill Rate
— — — — — | — — — — —
Display | 75%
Video | 68%
Native | 72%
- Action Required: Improve fill rate for Video ads to meet the constraint.
Revenue Metric Example: Revenue Per Mille (RPM)
- Target: $2.50
- Current Data:
Date | RPM
— — — — — -| — — —
2023–09–01 | $2.35
2023–09–02 | $2.48
2023–09–03 | $2.52
2023–09–04 | $2.41
- Analysis: RPM is trending close to target but needs consistent improvement.
Marketing Constraint Example: Maximum Ads per Page
- Constraint: Ads per Page ≤ 4
- Current Data:
Page Type | Avg Ads per Page
— — — — — | — — — — — — — — —
Homepage | 3.5
Article | 4.2
Gallery | 3.8
- Action Required: Reduce ad density on Article pages to meet the constraint.
Marketing Metric Example: User Engagement Score
- Target: ≥ 7.5 (scale of 1–10)
- Current Data:
Ad Placement | Engagement Score
— — — — — — -| — — — — — — — — —
Header | 7.2
Sidebar | 6.8
In-Content | 7.9
Footer | 7.4
- Analysis: In-Content ads are performing well, while Sidebar ads need improvement.
As we noted in our article summary above, a balanced approach is key where revenue needs have to be balanced with user experience criteria. To do this, we need to identify cross functional constraints and metrics. For example:
Cross Functional Balance — Revenue vs. User Experience
- Constraint Balance: Maximize RPM while maintaining User Engagement Score
- Current Data:
Ad Density | RPM | User Engagement Score
— — — — — -| — — — -| — — — — — — — — — — —
2 ads/page | $2.20 | 8.1
3 ads/page | $2.55 | 7.8
4 ads/page | $2.80 | 7.3
5 ads/page | $2.95 | 6.9
- Analysis: The optimal balance appears to be 3 ads/page, maximizing RPM while keeping the User Engagement Score above 7.5.
Cross Functional Metrics — Overall Platform Performance
- Targets:
- Revenue: $1,000,000 per day
- User Satisfaction: ≥ 4.5/5
- Advertiser Satisfaction: ≥ 4.5/5
- Publisher Satisfaction: ≥ 4.5/5
- Current Data:
Date | Revenue | User Sat. | Advertiser Sat. | Publisher Sat.
— — — — — -| — — — — — — | — — — — — -| — — — — — — — — -| — — — — — — — —
2023–09–01 | $980,000 | 4.6 | 4.4 | 4.7
2023–09–02 | $1,020,000 | 4.5 | 4.6 | 4.6
2023–09–03 | $995,000 | 4.7 | 4.5 | 4.5
2023–09–04 | $1,050,000 | 4.4 | 4.7 | 4.8
- Analysis:
- Revenue is generally meeting or exceeding the target.
- User satisfaction dropped on the highest revenue day, suggesting a potential trade-off.
- Advertiser satisfaction is improving, possibly due to better performance.
- Publisher satisfaction remains consistently high.
Visualizations — Cross Functional Alignment
We can now create some simple visualizations using the fictitious dataset to illustrate these constraints. These could help stakeholders from marketing, revenue, and data science align on strategies and refine their approaches to maximize both user engagement and revenue.
Here’s a breakdown of the new charts:
1. Ad Density vs. User Engagement and Revenue (Scatter Plot)
- Shows how increasing ad density affects both user engagement and revenue.
- Helps find the optimal balance between ad density, user experience, and revenue.

2. User Segment Performance (Bar Chart)
- Compares CTR, conversion rate, and revenue across different user segments.
- Aids in identifying high-value segments and tailoring strategies accordingly.

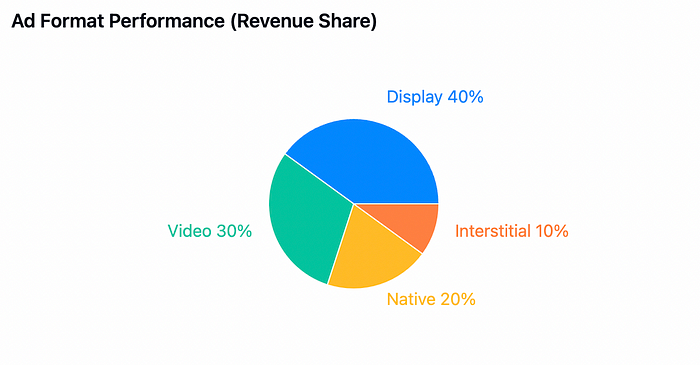
3. Ad Format Performance (Pie Chart)
- Displays the revenue share of different ad formats.
- Helps in allocating resources and optimizing the ad format mix.
4. Performance by Time of Day (Line Chart)
- Shows how CTR and revenue vary throughout the day.
- Useful for optimizing ad delivery and pricing strategies based on time.

These visualizations offer several benefits for stakeholder alignment:
- Balancing Revenue and User Experience: The Ad Density vs. Engagement chart clearly shows the trade-off between increasing ads (revenue) and maintaining user engagement. This can help marketing and revenue teams find common ground.
- Targeted Marketing Strategies: The User Segment Performance chart allows marketing to identify which segments are most valuable, while also showing revenue teams where the money is coming from. Data science can use this to refine targeting algorithms.
- Resource Allocation: The Ad Format Performance pie chart gives a clear picture of which formats are driving the most revenue, helping all teams prioritize their efforts.
- Timing Optimization: The Time of Day Performance chart can help all teams understand when ads are most effective, both in terms of user engagement (CTR) and revenue.
How these visualizations can be used:
- Marketing Team: Can use these to understand which user segments to focus on, what ad formats are most engaging, and when users are most receptive to ads.
- Revenue Team: Can identify the highest-earning segments, ad formats, and times of day to maximize revenue without sacrificing user experience.
- Data Science Team: Can use these insights to refine algorithms for ad serving, user targeting, and bid optimization.
By reviewing these visualizations together, the teams can:
- Set balanced KPIs that consider both engagement and revenue.
- Develop targeted strategies for different user segments.
- Optimize the ad format mix.
- Implement time-based pricing and serving strategies.
These data-driven insights can help align the teams’ strategies towards common goals, balancing the needs for user engagement and revenue generation.
This wraps up our discussion on Ads Supply Optimization for AdX Global SSP their path to identifying key constraints and metrics working cross functionally to achieve the balanced revenue and user experience outcomes. In future articles, I will explore how machine learning plays in this journey with the same constraints and optimization outcomes